Note
Go to the end to download the full example code.
NumPy integration
It is possible to easily go between NumPy and APyTypes and therefore also use plotting tools like Matplotlib in an integrated manner.
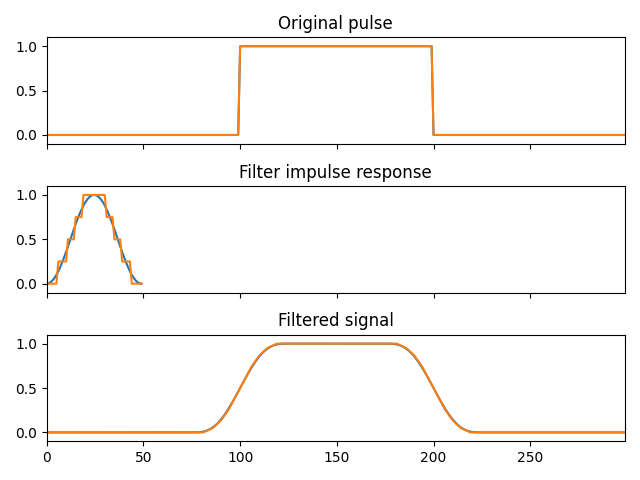
Consider the example from https://docs.scipy.org/doc/scipy/reference/generated/scipy.signal.convolve.html implemented using fixed-point arithmetic
import matplotlib.pyplot as plt
import numpy as np
from scipy import signal

import apytypes as apy

sig = np.repeat([0.0, 1.0, 0.0], 100)
sig_fx = apy.fx(sig, bits=12, int_bits=2)

win = signal.windows.hann(50)
win_fx = apy.fx(win, bits=10, int_bits=2)

filtered = signal.convolve(sig, win, mode="same") / sum(win)
filtered_fx = apy.convolve(sig_fx, win_fx, mode="same") / sum(win_fx)
The results can then be plotted in Matplotlib
fig, (ax_orig, ax_win, ax_filt) = plt.subplots(3, 1, sharex=True)
ax_orig.plot(sig)
ax_orig.plot(sig_fx)
ax_orig.set_title("Original pulse")
ax_orig.margins(0, 0.1)
ax_win.plot(win)
ax_win.plot(win_fx)
ax_win.set_title("Filter impulse response")
ax_win.margins(0, 0.1)
ax_filt.plot(filtered)
ax_filt.plot(filtered_fx)
ax_filt.set_title("Filtered signal")
ax_filt.margins(0, 0.1)
fig.tight_layout()
fig.show()
Total running time of the script: (0 minutes 0.660 seconds)